
New Hardiness Zone Map Released!
go.ncsu.edu/readext?970190
en Español / em Português
El inglés es el idioma de control de esta página. En la medida en que haya algún conflicto entre la traducción al inglés y la traducción, el inglés prevalece.
Al hacer clic en el enlace de traducción se activa un servicio de traducción gratuito para convertir la página al español. Al igual que con cualquier traducción por Internet, la conversión no es sensible al contexto y puede que no traduzca el texto en su significado original. NC State Extension no garantiza la exactitud del texto traducido. Por favor, tenga en cuenta que algunas aplicaciones y/o servicios pueden no funcionar como se espera cuando se traducen.
Português
Inglês é o idioma de controle desta página. Na medida que haja algum conflito entre o texto original em Inglês e a tradução, o Inglês prevalece.
Ao clicar no link de tradução, um serviço gratuito de tradução será ativado para converter a página para o Português. Como em qualquer tradução pela internet, a conversão não é sensivel ao contexto e pode não ocorrer a tradução para o significado orginal. O serviço de Extensão da Carolina do Norte (NC State Extension) não garante a exatidão do texto traduzido. Por favor, observe que algumas funções ou serviços podem não funcionar como esperado após a tradução.
English
English is the controlling language of this page. To the extent there is any conflict between the English text and the translation, English controls.
Clicking on the translation link activates a free translation service to convert the page to Spanish. As with any Internet translation, the conversion is not context-sensitive and may not translate the text to its original meaning. NC State Extension does not guarantee the accuracy of the translated text. Please note that some applications and/or services may not function as expected when translated.
Collapse ▲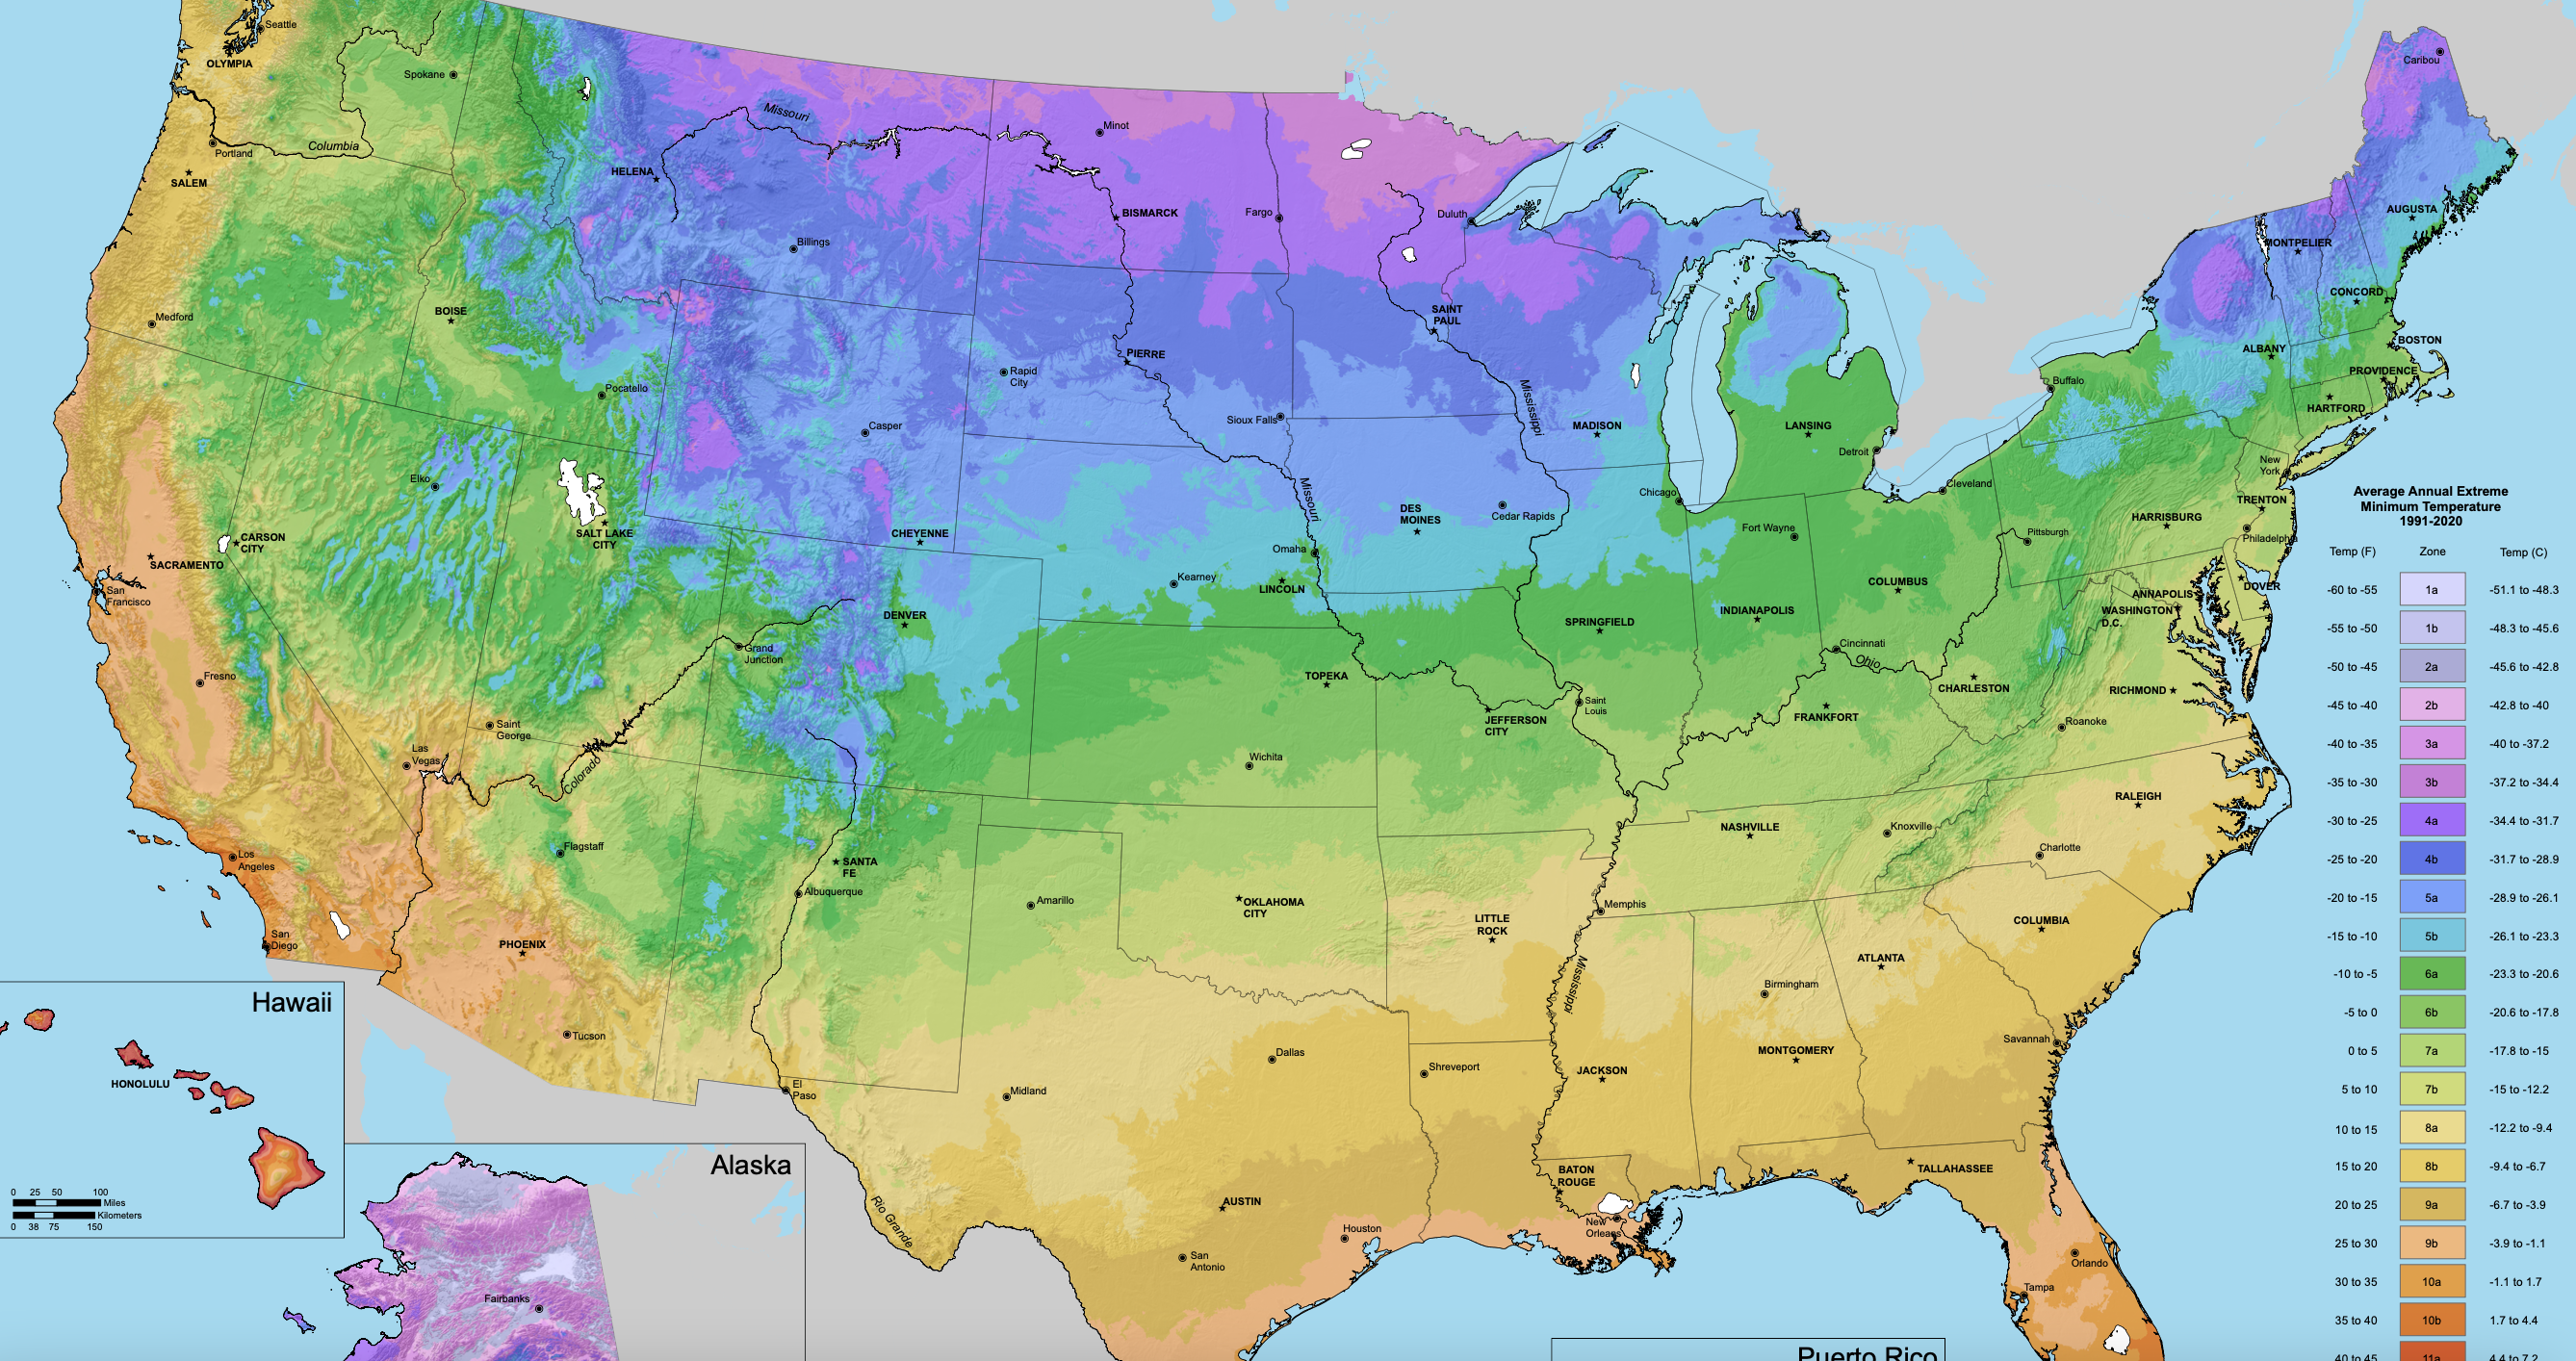
New USDA Hardiness Zone map. Source USDA
The new USDA Plant Hardiness Zone Map (PHZM) has been released! This map is the newest model published since 2012. So what exactly is a hardiness zone map, and what is different in this newly released edition?
A hardiness zone map is based on the average annual extreme minimum temperature recorded. There are a total of 26 zones, ranging from zone 1a (the coldest at -60°F to -55°F) to zone 13b (the warmest at 65°F to 70°F). Hardiness zone maps, and in particular zone categories are useful for both consumers and growers to know generally the average lowest temperatures in our areas to inform us about plant selection for our gardens and nurseries. These hardiness zones do not represent the coldest values it has ever been recorded in our areas, but rather show the average lowest winter temperatures over a span of 30 years (in the case of the most recent map). Gardeners should keep this in mind and understand that past weather records cannot provide a great forecast for future variations in weather, therefore one should use the map along with other resources through your local Extension office to determine what works best for your locale.
The new hardiness zone map released this year has been created using GIS (Geographic Information System) to examine hardiness zones at a much finer scale than earlier maps. The USDA uses a algorithm derived from Oregon State University’s PRISM, which is a highly advanced climate mapping model. This model is used to estimate the mean annual extreme minimum temperature for each pixel on the map by using local weather stations to help determine how elevation changes, coastal effects, temperature inversions, and topography impact hardiness zone estimation for hyperspecific locales. Data was drawn from a period of 30 years of observation, and then fine-tuned to balance out fluctuations of year-to-year weather variation and establish baseline climate “normals” for the U.S. region.
There are several things to note in this new edition of the map. The new map now has the ability to get highly specific and has a ZIP Code zone finder tool where you can simply type your code in the box, and your hardiness zone will be reported. More weather stations were used than ever before in compiling this map totaling 13,625 stations for higher accuracy. In general, when comparing the new map with the past editions published in 2012, and 1990, zone boundaries predictably have changed over time. Climate change evidence is usually based on trends in overall average temperatures recorded over 50-100 years, therefore the USDA Hardiness zone maps should not be used alone as evidence of climate change. It is worth mentioning that in general the new map is one quarter-zone warmer than what was previously reported in 2012 throughout much of the United States according to the USDA. More specifically, in our region here in WNC, in 2012 much of our region was on average 6b or 7a. In the 2023 edition of the map, 7a and 7b tend to be the most common for much of our area. So what does this change exactly mean for us? Well it definitely doesn’t mean that you should rip up your gardening plans, or tear plants out of the landscape. Microclimates in the landscape still play a critical factor, with hardscapes and other landscape elements providing protection or topography dips causing temperature sinks allowing for more of a cooling effect being a few examples of microclimates in action. Microclimates can slightly change what hardiness zone classification your plants might be in by offering additional protection or by taking some away. Essentially the change in hardiness zone means that plants that were once on the fringes of growing in our area could perhaps perform better or worse due to our shifting weather patterns and climate. Continue to trial plants in your gardens and nurseries to see how they might do in your particular area while knowing the risks that can come in hard freezes to our region, and warm seasonal weather.
I hope that this provides some clarification on hardiness zone map formation, and hardiness zone use. For more information and resources, check out the Weather resource page. You can access the news release from the USDA about the map online. See the links below for more information.
Sources: